In short
The particle counts stated on exosome product pages in our Index run from 3 × 10⁶ to 1 × 10¹⁴, a spread of about 7.5 orders of magnitude, roughly the gap between one second and one year. Part of that spread is probably real, because sources, preparations and fill volumes differ. Part is probably measurement: in one published comparison, particle concentrations differed by up to two orders of magnitude across methods and cell sources. A single number on a page can’t tell you which part you’re looking at.
How far apart are the particle counts on exosome product pages?
Very far. Our Product Index records 168 products from 73 brands, from their product pages on 4 November 2026. 22 of those pages state a figure that reads as a particle count. 20 of the 22 call what they count “exosomes”; 2 say “particles.” The smallest is 3 × 10⁶. The largest is 1 × 10¹⁴. The ratio between them is a little over 3 × 10⁷, about 7.5 orders of magnitude.
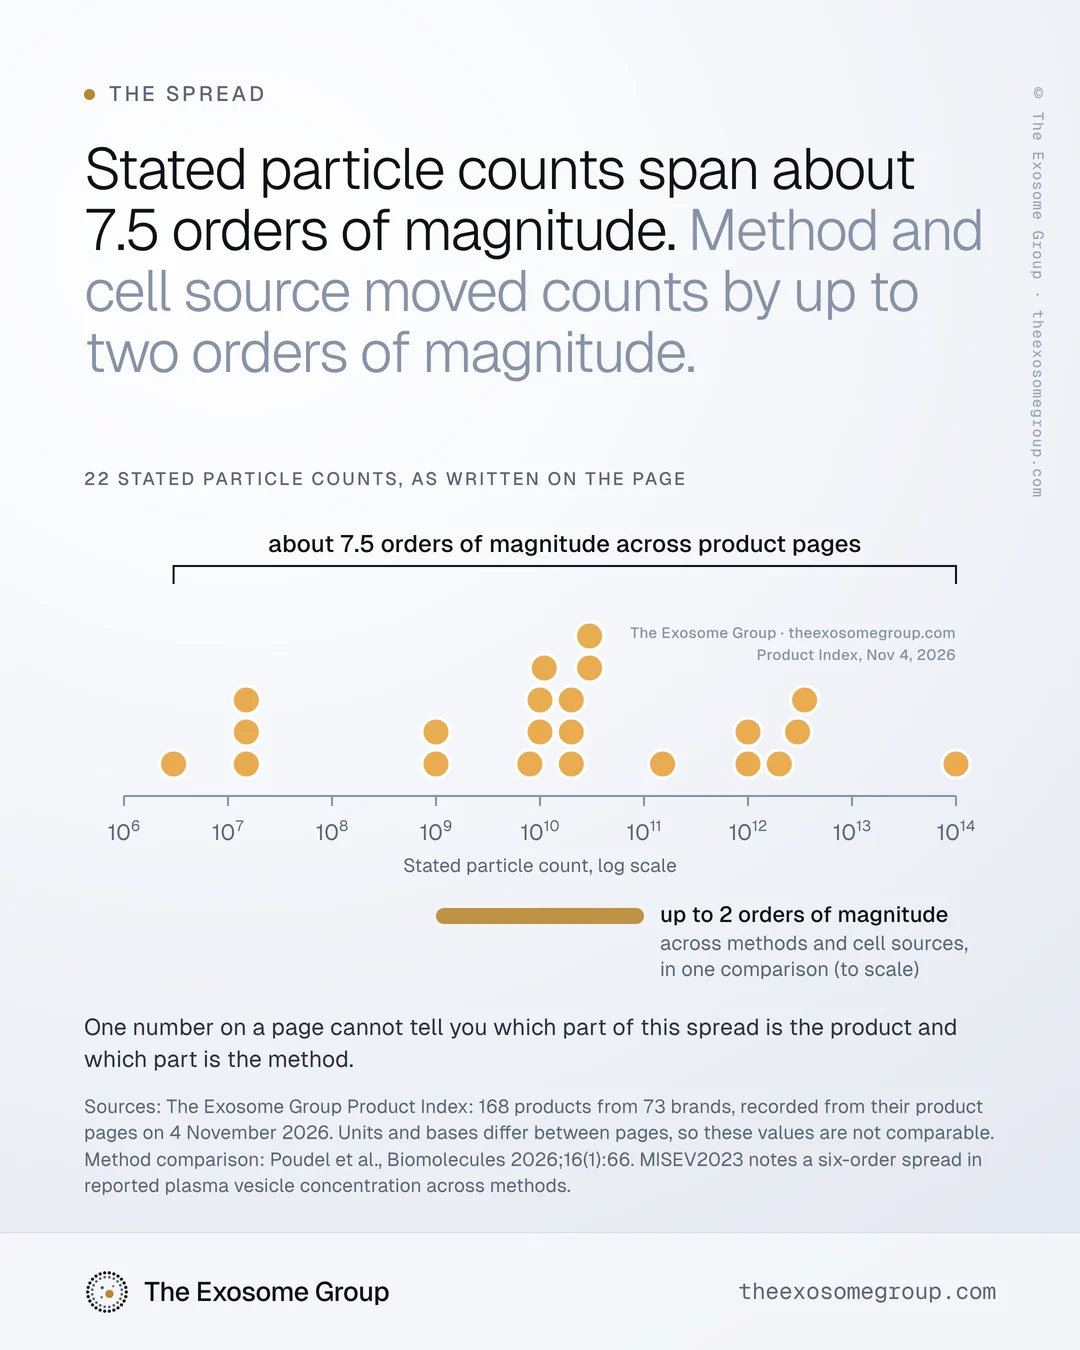
The counts don’t spread evenly. Grouped by order of magnitude:
| Stated count | Counts |
|---|---|
| 106 to below 108 | 4 |
| 108 to below 109 | 0 |
| 109 to below 1010 | 3 |
| 1010 to below 1011 | 8 |
| 1011 to below 1012 | 1 |
| 1012 and above | 6 |
The middle value of the 22 is 2 × 10¹⁰. Twelve of the counts sit from 109 up to just below 1012, with four below that range and six at or above it.
The chart leaves out 17 of the 39 numbers that pages state for vesicle quantity: 12 percentages, 3 ppm figures and 2 pages that say “billions” without a figure. None of them can sit on a count axis, because none of them is a count. They describe how much of an ingredient went in, or nothing checkable at all.
What does 7.5 orders of magnitude look like?
A year has about 3.2 × 10⁷ seconds, so the gap between the smallest and the largest count is roughly the gap between one second and one year.
It is also why the chart above uses a log scale, where each step to the right is ten times the one before. On an ordinary axis, every count but the largest would sit in a pile at zero, and the smallest would be invisible.
How much of the spread could be real?
Some of it, almost certainly. The pages describe different things. Sources differ: the 22 counts come from pages naming plant, human-derived, microbial, milk and synthetic material, from one page naming a cell type with no species, and from pages that name no source. Preparations differ. Fill volumes differ, from a single vial to a jar.
The bases differ too. Of the 22 counts, 10 are stated per bottle, vial or jar, 1 per pump, 1 per dropper, and 10 with no basis at all. A per-pump count and a per-bottle count for the same product would differ by the number of pumps in the bottle before anything else changed. So a wide range across pages is expected even if every count were measured perfectly.
A per-bottle figure is also a calculation unless someone counted a whole bottle: a measured concentration multiplied by a fill volume, which assumes the product is uniform and the fill is what the label says. Where the concentration was measured, on the raw ingredient or in the finished formula, changes what the per-bottle figure can mean.
How much of the spread could come from the measurement?
Also some, and possibly a lot. The best evidence comes from studies that measure the same material more than one way. In a 2026 study, vesicle materials from two cell sources were measured four ways. Three methods reported concentration: particle tracking analysis, asymmetric flow field-flow fractionation and microfluidic resistive pulse sensing. Cryo-electron microscopy was used for size only. Particle concentrations differed by up to two orders of magnitude across methods and cell sources, and the size distributions from the other three methods all skewed larger than cryo-electron microscopy (Poudel et al., Biomolecules, 2026).
For the same material, the method alone moved the concentration by up to about 70-fold. The largest gaps involve asymmetric flow field-flow fractionation, which the authors describe as less accurate for vesicle concentration.
MISEV2023, the reporting guidance from the International Society for Extracellular Vesicles, makes the same point for blood plasma, where it notes that reported vesicle concentration spans six orders of magnitude depending on the measurement method. It describes particle number concentration as often unreliable, because many techniques lack specificity for vesicles.
Even in that one study, with reference materials measured side by side, method and cell source together moved concentrations by up to two orders of magnitude. That is more than a quarter of the 7.5 seen across product pages. None of the 22 counts names a method, so there is no way to tell how much of the spread on the pages is measurement.
A single figure also hides spread inside one measurement. For nanoparticle tracking analysis, MISEV2023 recommends reporting the size distribution rather than one summary number, because summary statistics are easily skewed by the limit of detection. A page that reduces a whole measurement to one count has dropped more than the method.
Can you compare particle counts between two products?
Only when both name the same method, the same instrument and the same unit, and ideally when both were measured in the same lab. None of the 39 pages that state a number names the method behind it. A comparison between two pages compares two numbers whose meaning is unknown.
| What has to match | Why |
|---|---|
| Method, instrument and settings | In one comparison, concentrations differed by up to two orders of magnitude across methods and cell sources |
| Unit and basis | Per mL, per gram, per bottle and per dose are different quantities |
| What was measured | A raw ingredient and a finished formula are different samples |
| Lot and date | A count belongs to one batch at one moment |
| Blank | Without one, background can’t be separated from signal |
This is the uncomfortable part for anyone selling on the number. When a product claims more exosomes than a competitor, the only useful reply is a question: measured how? A larger number on its own doesn’t show that more vesicles are present. It may show a different method, a different unit or a different basis.
There is a word question underneath as well. MISEV2023 recommends calling these particles extracellular vesicles, or EVs, and keeping “exosome” for vesicles shown to come from the cell’s endosomal system. A count by light scatter can show neither. It counts particles in a size window, and What a particle count counts explains why that is not the same as counting vesicles.
What this distribution does not tell you
- Which page is right. A spread of stated numbers can’t rank them, and we don’t.
- How many vesicles are in any product. These are the numbers as written on the page. We measured nothing.
- That the counts are comparable. They aren’t: units and bases differ between pages, which is part of the point.
- Whether a product works. That is outside what we do.
What to ask for
If you are comparing two counts, ask both suppliers for the same four things: the method and instrument, the unit with its basis, the lot and date, and the blank. If the methods differ, the counts don’t compare. If the units differ, convert only with a stated fill volume or dose. If either supplier can’t answer, the comparison stops there. Five lines behind every particle count sets out the full request.
If you are setting a count for your own label, choose the method first and keep it. A count measured the same way, lot after lot, can show change over time. A count that switches methods can’t. Write the basis into the claim itself, so the number never travels without it.
We record what a page says. We do not evaluate the product.
Want the distribution behind a specific claim type, or a second read of your own count? Email hello@theexosomegroup.com.
Last reviewed . General scientific information about measurement. Not legal or regulatory advice, and not an assessment of any product.
Sources
- The Exosome Group Product Index: 168 products from 73 brands, recorded from their product pages on 4 November 2026. Each product’s page uses exosome or extracellular vesicle wording. Published as distributions only; no brand, product or page is named.
- Poudel S et al. Intermethod characterization of commercially available extracellular vesicles as reference materials. Biomolecules. 2026;16(1):66. PMID 41594606.
- Welsh JA et al. Minimal information for studies of extracellular vesicles (MISEV2023). J Extracell Vesicles. 2024;13(2):e12404.